Last week saw the launch of the SaaS version of DFRNT, a tool to model and build data products. Built on top of TerminusDB, DFRNT gives digital architects the means to capture, navigate, and visualise complex graph data structures with accuracy and ease.
Having used DFRNT and had the pleasure of a demo from product creator Philippe Höij, we wanted to do a quick write-up of DFRNT as we know many of our readers have a keen interest in ontologies, data modelling, and graph visualisation.
What is DFRNT and who is it for?
DFRNT is a browser-based tool for digital architects and an advanced data/ontology modeller with graph visualisation. There is a free version, a SaaS version that includes hosting of TerminusDB graph data products, and a version for self-hosted (on localhost) TerminusDB instances.
It provides access to an advanced bounded knowledge graph model which is fully type-checked, follows RDF semantics, and exposes both datalog and JSON-LD document APIs for schema, queries, and updates. The model scales from personal knowledge graphs, all the way up to enterprise data product use cases.
The product has been developed to do good. To help teams collaborate. To confront global issues such as climate change, global pandemic responses, and biodiversity challenges. And to make a positive difference to societal forces like healthcare, economic equality, and racism. A tool to help build shared data structures necessary to navigate the complexities changemakers face making an impact at scale.
Creating change for such huge issues is no easy task. It requires collaboration, thought, and experimentation. A place for academics, business leaders, philanthropists, and digital architects to hypothesise, visualise, share, and plan. These challenges are not predictable, but with a focus on a shared vision and expected outcomes, the chances of success are greatly enhanced. The DFRNT launch brings core tools to address graph data collaboration where complexity is high and to allow explorers to express graph data freely in the way it should be shaped.

DFRNT for Business
DFRNT helps businesses do good too. The challenges organisations face are complex. Cybersecurity, risk assessments, carbon emissions, and regulatory compliance are costly headaches, relationship-heavy, and difficult to understand.
Digital architects, data scientists, and changemakers routinely have to resort to their corporate-imposed collaboration toolbox of Powerpoint, Excel, and whiteboard applications offered centrally. It is a big stretch to call these graph tools and using inappropriate tooling makes solving problems that involve exploration and ideation based on hyperconnected datasets extremely challenging.
To help these experts work well, they need multiple perspectives (canvases), data enrichment, and advanced query engines. A significant reason for Philippe to build DFRNT was to build a tool to serve his own needs as a digital and security architect.
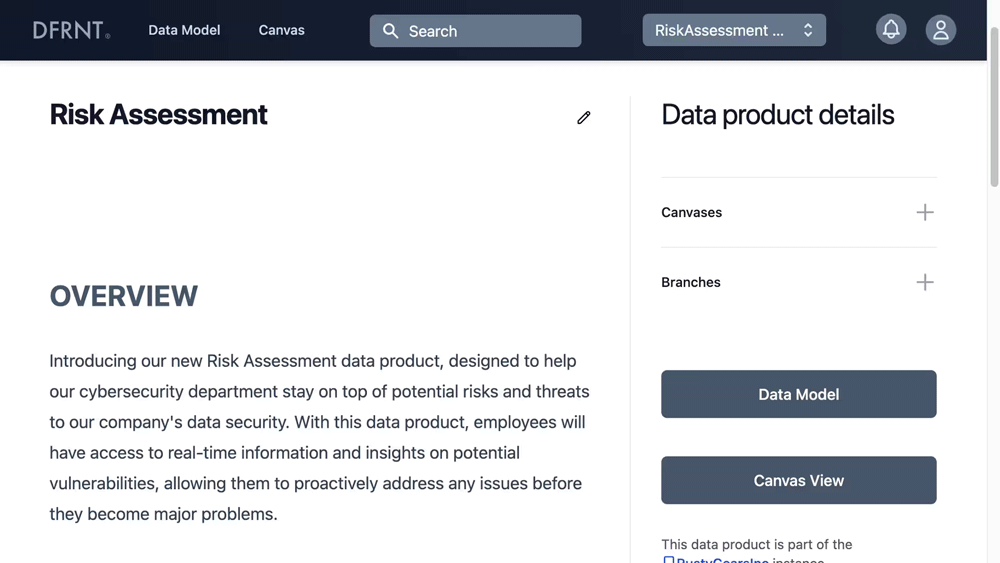
Here’s an example of DFRNT in action, using a risk assessment model aimed at helping a business’ cybersecurity department plan and mitigate security vulnerabilities and cyber threats. The data product view features the ability to describe data products using markdown to present the risk model cleanly and informatively to business users.
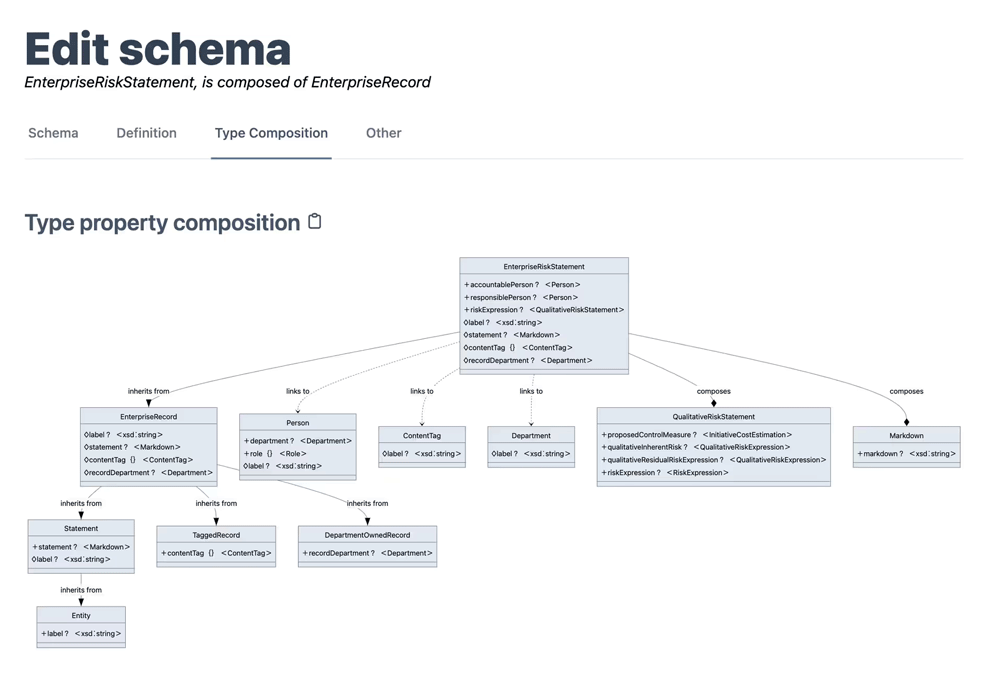
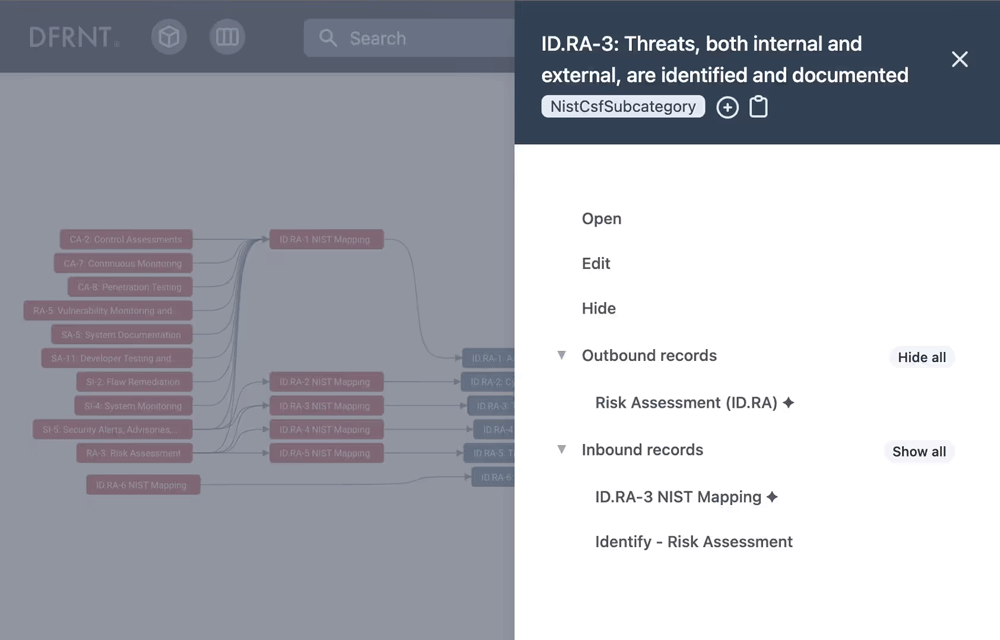
The risk model is then modelled using types and traits, modelled data structures attached to the types as properties. The example below is of an advanced type definition that uses both multiple inheritance and property composition (traits) for how a qualitative risk JSON-LD type may be modelled. Additionally, there is a recognized markdown data structure that enables strings to be recognized as markdown and rendered, which enables risk details to be expressed in formatted prose and be part of the data model. Risk data is then rendered together with inbound and outbound links to other elements of the graph to easily navigate the graph from a data exploration perspective.
The final image shows the canvas feature of DFRNT. Select data to add to a canvas for graph visualisation. Be as granular as you like, for example, view the relationships between a single entity or take a look at the bigger picture and see the model as a whole. With the ability to save canvases and download them as images to use elsewhere, this is a great feature to share and understand the structure of the problem being solved.
The Need for DFRNT
Relational databases and SQL are the most popular type of database and query language. They are well-suited for organising and managing structured data in an efficient manner, however, they are not well-suited for certain types of tasks, such as:
- Working in a model-driven approach with embedded schema and embedded semantics.
- Performing complex mathematical computations or data analysis.
- Handling real-time data streams or running large numbers of concurrent users.
- Handling graph or hierarchical data.
Enabling hierarchical grouping of buckets that are of the same kind. - Making it easy to build thin apps that leverage the semantic model directly.
These types of tasks are often at the heart of the problems that DFRNT is helping to solve. A better solution for these tasks is an RDF graph database that exposes schema-ful/typed data structures.
Predictions for the exponential growth of graph database adoption have been a feature of many ‘future trends’ reports, but this growth has never quite hit the forecast heights. Part of this problem has been a high barrier to entry. One of the main barriers to entry is data modelling. Graph databases require a different approach to data modelling, which can be challenging for developers who are used to working with relational databases.
Despite the increasing popularity and maturity of graph databases, the lack of adequate modelling tools for them remains a major hindrance to their wider adoption, leaving many businesses and people struggling to harness the full potential of this powerful technology.
What has been needed is the business-orientated TerminusDB-style closed-world interpretation of OWL, with strongly typed, discernable, and predictably structured graph data. Additionally, using a document-orientated style to express the graph makes taxonomies and ontologies easy to formulate and attach data properties and structures to. Data instances become clearly expressed in a schema with semantic descriptions.
DFRNT is a service that makes this expressive TerminusDB way of modelling easy to use, we find this a remarkable feat. It radically simplifies data and ontology modelling, gives a whole new generation of digital architects powerful tools and makes it even easier for those already in the field.
Where TerminusDB fits in
TerminusDB is used as DFRNT’s engine for graph data product instances.
TerminusDB is an open-source (Apache 2.0) data model and hosting platform, professionally maintained by the TerminusDB team so you don’t have to.
It features a secure version control system for collaborative data modelling, including branching for experimentation, prototyping, and enhanced resilience. Any changes made are tracked with accuracy and security.
These ‘git-for-data’ features were essential for DFRNT to provide a truly collaborative data product builder with several innovations to make cross-data product collaboration easy. Data developers can create a branch (shallow copy) of the main data branch and later “rebase” their changes on top of updates made later in the main (official) branch. Pull and push to remote branches are also elegantly implemented without the usual key-handling complexities. Errors and mistakes can be fixed quickly by branching an older version to retrieve old data, or rolling back to a known good version of the data product, just like working with code,
DFRNT provides peace of mind knowing that your database remains secure and up to date no matter what happens during development and editing processes.
Get started with DFRNT
Getting started with DFRNT is quick and easy. If you, or if you know of other fellow digital enthusiasts who want a better way to model data for complex problems, give it a go, their details are:
Visit dfrnt.com.
Follow DFRNT’s progress on Twitter and LinkedIn.