This article discusses the situation with Silicon Valley Bank and how existing tools, such as graph databases and the Ising Model, can help regulators provide better financial governance.
In one sense, it looks like a fairly straightforward bank run, but the extraordinary bailout announced directly after suggests that the risk was systemic. Whether that was all the VCs shouting contagion in the crowded theatre or something deeper under the hood, it certainly got the federal administrators moving. By Sunday evening the bailout was done and deposits were available on Monday morning.
Banks are all about maturity mismatches, so the mismatch between the mortgage-backed securities and the interest rate isn’t sufficient to explain the problems. Truthfully, no bank has the capital to handle a full-blown (and in this case twitter-led) instant bank run. Bank business models don’t work like that. So the proximate causes of the problems with SVB are well described.
My personal problem with the whole situation is that the leadership, equity holders, shareholders, and other insiders in SVB, and the other banks that went bust, are allowed to retain the private gains they pocketed over the last number of bumper years while the taxpayer has to clear up the mess. They get to pick the pennies from in front of the proverbial steamroller, but the public gets crushed when they pick a penny too far. That discretion to create private fortunes destroys incentive alignment in what is effectively a public utility. While the details are different, the system fundamentals are the same as in ‘08.
In any case, this article is more about how visibility into a financial system allows you to understand systemic risk.
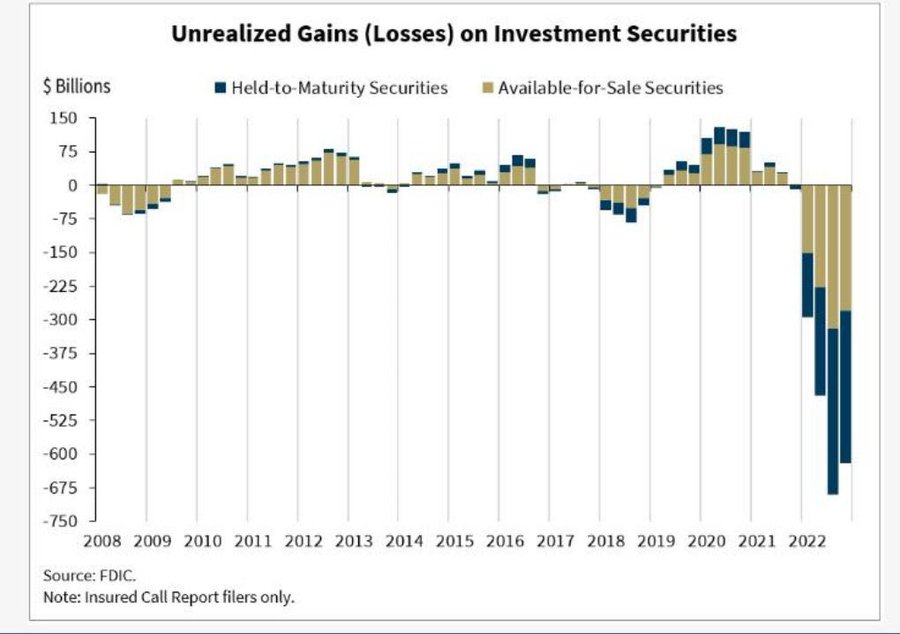
So what happened in 2008? At the base, financial assets were mispriced due to systemic risk. That systemic risk came from unknown network dependencies. The chart below which highlights the spectacular amount of unrealized losses in the US right now (trillions of dollars) probably points us toward the reason behind the aggressive response to SVB’s failure from the Fed and the FDIC. While the mortgage-backed security in SVB was only 80bn, there are enormous unrealized losses in the system and there is no realistic way to understand network dependencies.
The deals are private, the entities are clouded, the offshore actors are manifold, and the data is not available for us to crunch. It is therefore difficult to map. We would need a motivated actor that had a stake in understanding financial governance – perhaps a regulator that centered public interest at the expense of private interest.
Let’s start at the start: what is a price? A price is a numerical value we place on something, either real or abstract, that balances both the benefits and the risks associated with that entity. We all think we know the price, but if you don’t know the risk, and can’t see the dependencies, you don’t know the price. The Irish government found this out when they gave the ‘cheapest bank guarantee in history’. No idea of the risk, so no idea of the price. The net cost of that failure to understand was about €45bn, or between a quarter and a third of 2010 gross national incomes. A high cost for a catastrophic failure.
So we all sort of know this is a problem, but what have we been doing about it since 2008?
This is from a European Central Bank paper called ‘Recent Advances in Modelling Systemic Risk Using Network Analysis’ from 2010:
“In July and August 2007 the asset-backed commercial paper (ABCP) market collapsed... A crisis of confidence ensued which gripped money market mutual funds and the commercial paper market... Then, the collapse of Lehman Brothers in September 2008 transformed a pessimistic and disoriented mood into a full-blown panic...”
The financial crisis has reminded us how important it is to look at the links and connections of the financial system…”
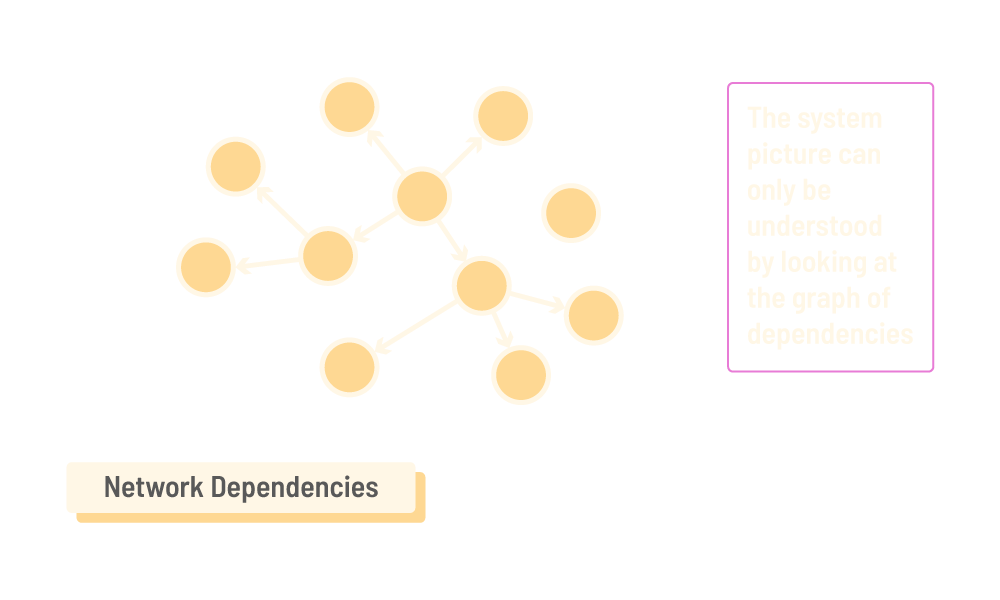
We know that we have to be able to consider network dependencies if we are going to be able to get a good picture of risk. A graph provides the ideal analysis workhorse to model, understand, and analyze that risk. If you model it effectively and have a powerful graph query language, you are a good way toward your goal.
When considering network dependencies, what does our model need to capture? For starters, it must capture the relationships which lead to dependent probabilities (for instance: mortgage back security rate, credit exposure, and vast uninsured deposits). It should also allow us to estimate exposures for unknown dependencies (resource dependencies or failed internal processes). If it is going to be useful, our model should give us a quantitative mechanism for translating knowledge of these relationships into a risk and a price. And it should be able to characterize the real contagion effects seen in practice (this is hard in a world of imperfect knowledge, but characterization will significantly improve our modeling).
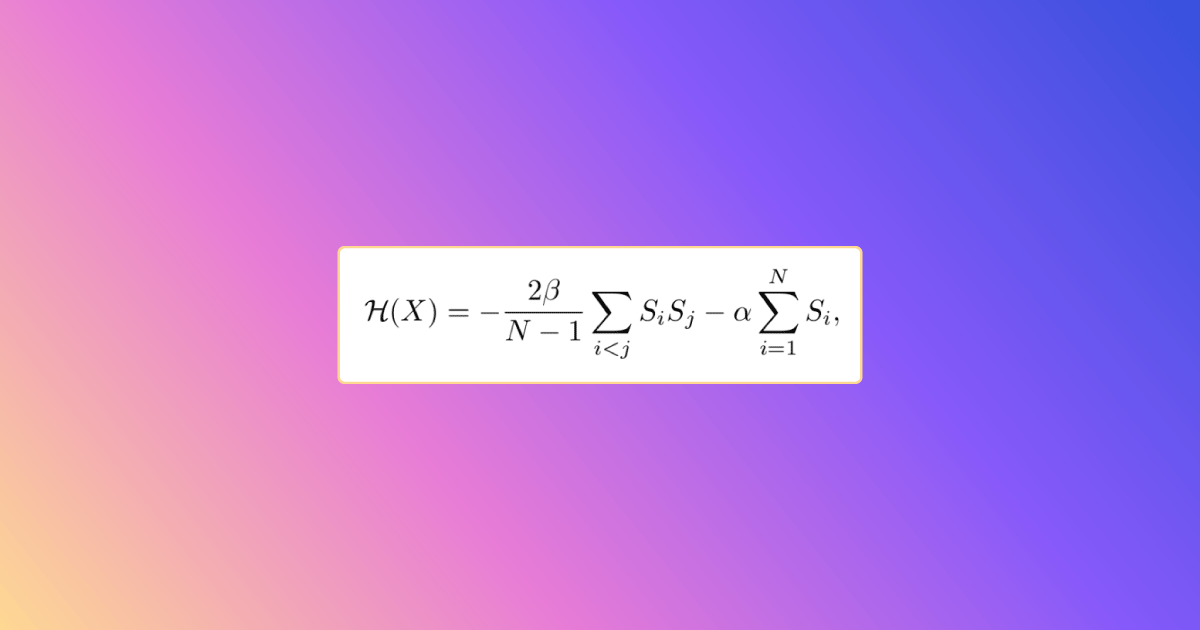
For network risk folks, graph modelers, and derivative risk price professionals, this is a familiar problem. The family of models that have these features is called Probabilistic Graphical Models (PGMs). The core techniques for working with them have been studied in condensed matter / statistical mechanics (Ising Model, Boltzmann Machine) for some years. For example, the Ising Model was solved by German physicist Ernst Ising in 1925. This group of techniques also includes Markov Random Fields (MRFs) and Bayesian networks, which we can adapt to the Ising Model formulae rather easily.
So the theory that can deliver this improved network understanding is solved and available. What we, and the regulators, really need is infrastructure. The theoretical solutions have been explored, what we need to make this a reality are simple ways to ingest and store graphical data. We need the ability to manipulate and represent model entities and relationship types. We need much, much better access to the data for computational crunching and testing. We also likely need assistance with parallel graph-flow type calculations (calculations of the form Aⁿ for some (sparse) matrix A representing connections in the graph).

How can the Ising Model can be implemented in huge datasets for better financial governance?
Current approaches to enterprise data management encounter serious problems. As
the size and complexity of databases increase over time, their agility approaches zero. The
combined cost of managing the code, infrastructure, and data increases steadily over time
and with scale until the cost of making changes becomes prohibitive.
The base solution to explore relationships and network dependencies at scale is a powerful graph database implementation, one that uses succinct immutable data structures for more sparing use of main memory resources.
Deep link analytics allows fast graph traversal of 10 hops or more across a very big graph (multi-billion nodes). This means better models, predictions & results. Hidden connections can be uncovered and problems can be discovered and minimized. Importantly, ultimate beneficiaries can be discovered no matter how deeply hidden in the data they are. This is crucial if you really want to understand the network. This can be a transformational technology in a new era of deep analytics.
We need to start putting these connections and dependencies at the center of our approach because without understanding them, we will always have a partial understanding of the state of the world. We will always be vulnerable to systemic dependency risk. Our society cannot adapt to constant financial crises, so we have to become better at managing these systems.
Better financial governance is available, we just need regulators to sit up and take notice