For startups achieving product market fit is crucial and can be the fine line that separates success and failure. From the get-go, a startup needs to identify the pain points of the customer and the precise problem they are addressing. If a business tries to address a non-existent problem or sell inferior goods that are not suitable to the market, it inevitably fails. Marc Andreesen, originally coined this term as ‘Product Market Fit’ which means being in a good market with a product that can satisfy that market.
The following challenges are faced by businesses that don’t achieve a product market fit:
- Customers who do not understand the product’s value
- Insignificant number of sales
- Lack of repeat customers
- Near zero virality
- Very long sales cycles
- Difficulty getting the word out and drawing media coverage through press releases
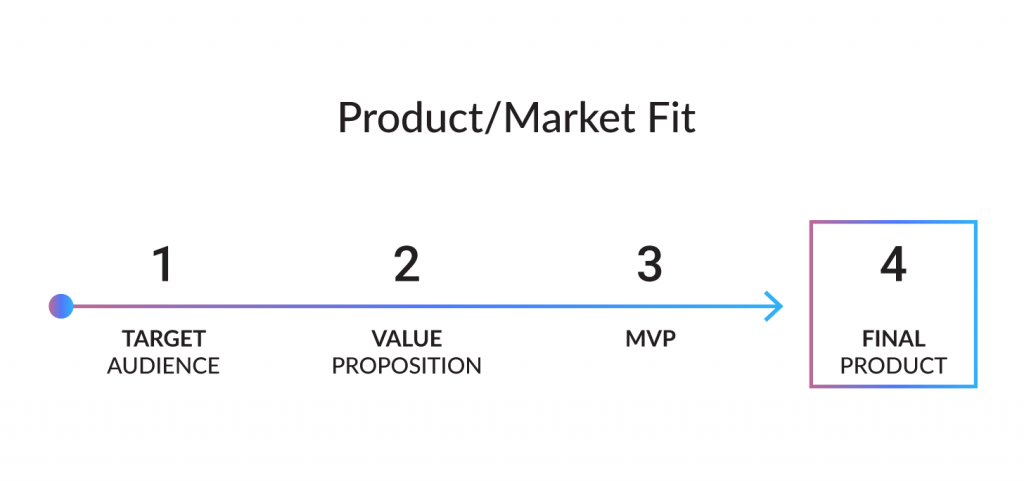
The first step to finding this market fit is by determining the target audience. Divide this audience into sections with common issues, behavior trends, and demographics, and then create personas that make clear who the customer really is for everyone involved in making the product. Explore the potential customers, their habits, and way of life to recognize latent or apparent needs, challenges, and desires. This helps recognize which issues can be addressed by your product.
The second step is finding a strong value proposition that is required for new products and businesses to succeed. What distinguishes your product from other competitors is that it should convey value and address real-life issues. The task is more complicated if you deliver a B2B2C product or expect to target diverse audiences. You will have to shape an offer of value for each audience because it will have different needs and challenges. And this can be difficult for a start-up that has limited resources.
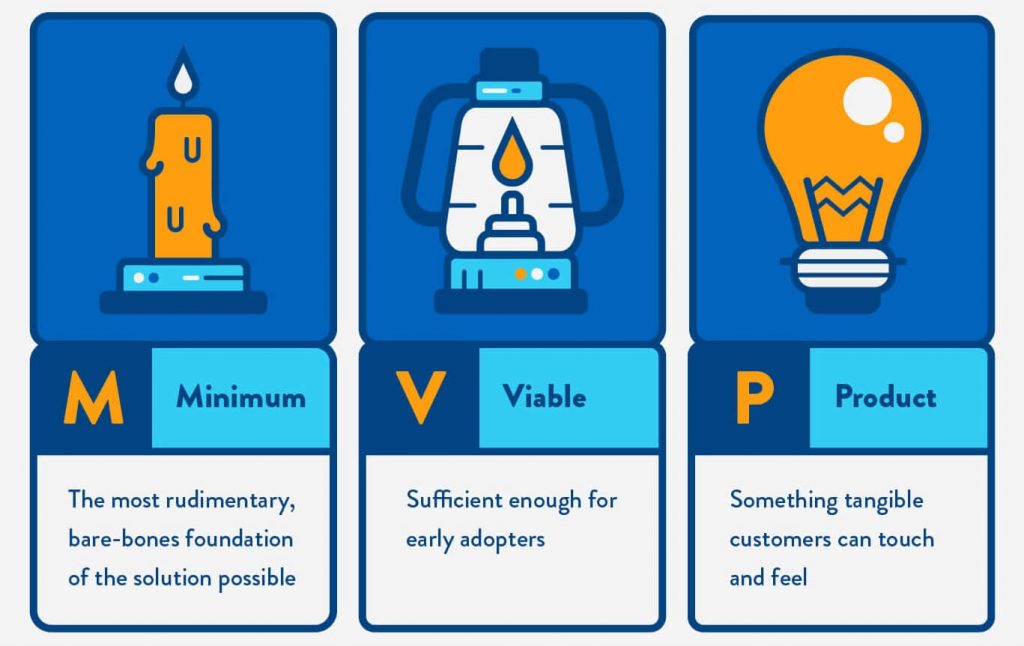
The third step is to mark out the features that are imperative to your brand. In other words, describe the feature set of the minimum viable product (MVP). Don’t use extra features to overload the MVP, as it doesn’t have to be perfect; it just has to work. The MVP is targeted at early users and it is their feedback that will enable you to refine and polish your product.

It’s time to launch the product in front of a big crowd after the creation of the MVP and a series of tests. Incorporate all the knowledge that you have obtained during prototyping, development, testing, and launch of the MVP. Always bear in mind during the development process that the final product should satisfy basic customer expectations and provide important functionality.
However, this is just the start. You will receive reviews and suggestions from users after the launch, which you can apply to keep improving the product. Scalability is key.
Measuring product market fit
In the initial stages, you usually see a fairly inconsistent resonance with your product. Then, the task at hand is to decide if a particular solution resonates with a specific subset of users and what characteristics are unique to that subset of users. Once you deploy the solution to that subset and find repeatability among those users, you have possibly found a stronger description of the target audience that resonates with the offering.
The first step in measuring market success is to set up analytics software such as Google Analytics, Matomo, Leadfinder, etc. There are a few key metrics that need to be tracked and optimized over time.
Bounce rate
When a user visits your website and leaves without engaging further, a ‘bounce’ happens. Your bounce rate tells you the proportion of visitors bouncing off your website after their first interaction.
Returning visitors
A visitor who returns to the website is known as a returning visitor. It illustrates that there was interest generated during the first interaction. A higher percentage of returning visitors points to a good product market fit and drastically reduces marketing costs.
Time spent on the website
Depending on the industry and the product, the average amount of time a user spends on a website varies. However, you can discover the average time per user by looking at analytics over time and discovering the competitors in your field. For example, at TerminusDB we typically look at achieving an average time of over two minutes getting at least three actions (page views, internal site search, download) per visit.
Demographics
Demographics are important for you to understand how consumers look for information and browse for online products and services. It also helps in identifying/profiling potential target audiences by matching measurable characteristics such as age, gender, and region.
Proactively improving the product
In search of product market fit, Marc Andreessen imparts some top-notch wisdom. He supports doing whatever is appropriate, which means embracing unpleasant changes. Changing teams, markets, products, brands, and goals are all sensible. That’s the story of several businesses – Instagram, Soylent, Amazon, and Twitter all drastically altered course from their initial strategy to find a match for the product market.

At TerminusDB as well our initial plan was to build large-scale graph systems for enterprises under the banner of Datachemist. We were focused on data quality and query – the ability to ingest complex data and then quickly return network-oriented queries.
But we were drifting into a consultancy model where our engineers did most of the implementation, which was painful when working with varied complex internal systems.
We were much more interested in being a technology partner. In Spring 2019, we decided to open source the database and in October 2019 TerminusDB was born. With the pandemic coming in it became harder to maintain a dual strategy as an enterprise product was reliant on sales and delivery. We made the early call to drop DataChemist and the direct to enterprise channel so we could focus all our efforts on open source.
In September 2020 TeminusHub was born targeted at SAAS customers with the main goal of being Git for data to promote collaboration among data people. Since then we have made huge strides forward with TerminusX, the cloud version of TerminusDB that is a toolkit for building collaborative applications and data products, and are looking to dominate the ecosystem in the coming years.
Engagement level
For a successful website, the engagement of the user is as critical as search engine visibility. It not only raises your brand’s visibility but also helps improve your SEO rankings. If customers start leaving your website within a short period of time, the bounce rates will increase and your Google SERP position will decrease. To understand these motivations it’s important to conduct surveys and engage through community channels such as discord and discussion threads. The involvement of the community in decision-making in a true open-source method can work wonders for product fit.
Customer lifetime value
One of the key stats to monitor as part of a customer experience program is the customer lifetime value (CLV). CLV is an assessment of the satisfaction of the customer not only on the basis of sales but over the entire relationship. To calculate this you take the
Customer revenue per year * Duration of the relationship in years – Total costs of acquiring and serving the customer = CLV
Another relevant metric that goes hand-in-hand is CAC (Customer Acquisition Cost). This is the money you spend to attract a new client, such as publicity, marketing, special deals, etc.
The formula for calculation:
Customer revenue per year * Duration of the relationship = Total costs of acquiring and serving the customer
Organic traffic
The key here is to build as many backlinks from credible relatable domains. As your organic traffic improves over time you can reduce spending on paid traffic.
K factor: Virality
In mathematical terms the formula is:
K= I x R
Where I is ‘Invitations’ or the number of people invited to use the service and R is the Conversion Rate of how many people actually signed up. Virality is based on compounding if K is less than 1 then you aren’t viral. And if K is equal to 1 you’re in a steady state where there is neither any growth nor decline. A positive viral coefficient rate of more than 1 would mean
- You provide a good user experience.
- You discovered the product/market fit
- You have a low acquisition cost,
- You’re likely to have high profitability

Churn and retention rate
The two best metrics for understanding whether or not you have achieved the correct product-market match are churn and retention rate. If your clients leave only after the first use of the product, it means that the necessary level of customer satisfaction has not been achieved. The greater the churn rate, the lower the chances for the right product-market match. At various points, you can assess the churn rate, such as if the product functionality failed to satisfy user expectations, if the UX interface was less user-friendly or other features required to be improved. Hence, it helps you know what the trend is giving you clear insights about the product market feedback.
Achieving product market fit conclusion

